
The timing of when leaves first start to appear on trees and their progression from increasingly green to brown (the study of phenology) gives us important indications about climatic conditions and vegetation functioning. The green-up of the tree canopy in particular is tied to the amount of warm days in spring and climate change means it is happening earlier on average. Understanding this relationship and how it varies between tree species is important. Not only does it have implications across the ecosystem, for example for pollinators, leaf-eating insects and dependant vertebrates, it also influences the amount of carbon dioxide taken up by the earth system by leading to longer growing seasons that may be more or less productive (Keenan et al., 2014, Dow et al., 2022).
Previously, observing this green-up of the tree canopy was possible by eye, by mounting cameras on poles (phenocams) or by using satellite observations. Drones now provide us with another perspective that combines some of the advantages of phenocams and satellites. Drones allow us to rapidly image woodlands and parts of forests. Because images have such fine resolution we can identify individual trees and shrubs within these surveys which isn’t possible with most satellite imagery. Like satellite sensors, drone-mounted cameras can now also provide us with information beyond visible light (near infrared) which is important for monitoring vegetation.
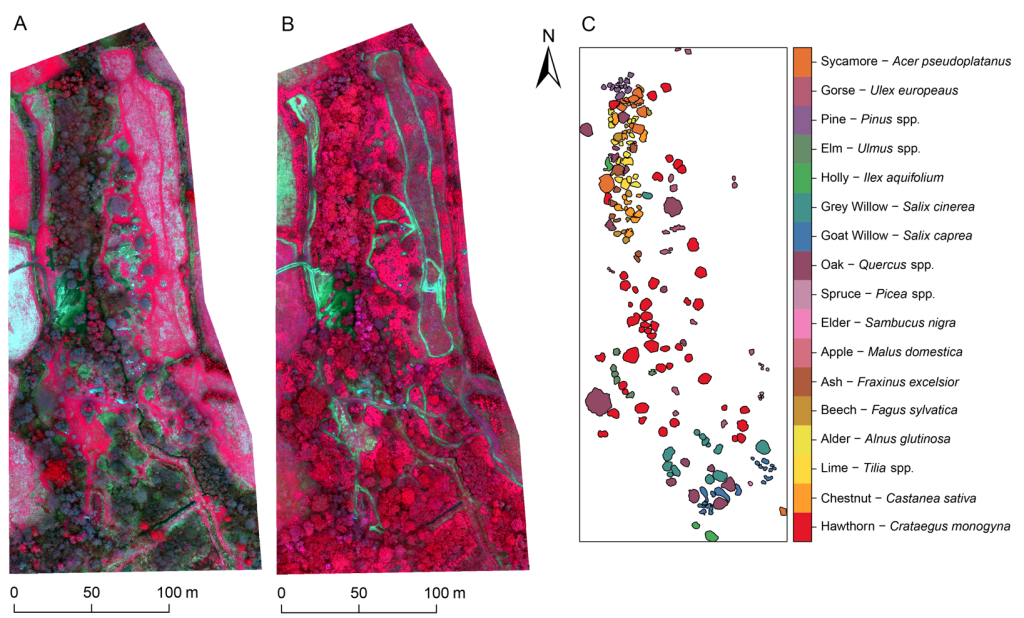
In this study we wanted to demonstrate how drones can be used to monitor and identify differences in the green-up of many different UK tree species. We focused on a woodland in Cornwall that was easily accessible for frequent revisits (Fig. 1). Besides monitoring the progression from leaf-off to full leafing out of individual trees, we were interested in the impact of sunny and overcast conditions on these observations. This is important when considering the practical applications of drone based monitoring, particularly in places where the weather is as diverse as in the UK.
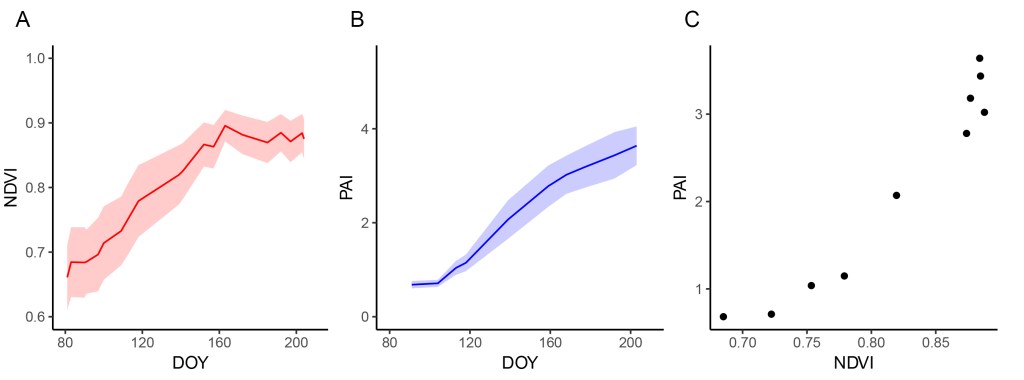
Our results showed that we can clearly identify species that have earlier and later green up (Fig. 2), for example Alder versus Oak, consistent with existing field observations. Drones therefore provide an exciting opportunity to monitor these dynamics at smaller, mixed species plot scales. We also demonstrated that the impact of sunny or overcast conditions seemed negligible, as long as we use a robust vegetation index (normalized difference vegetation index).

If we want to investigate the link between green-up timing and physiological changes such as increase in leaf cover, we can compare them using independent measurements. Observations of canopy leaf cover (from hemispherical photography) showed that the index values seemed to increase faster and saturate faster than leaf cover (Fig. 3). Saturation of vegetation indices as the canopy closes is well-known while the faster increase might be due to it picking up some of the background signals as the understory starts greening up prior to budburst of some trees. This should be taken into account and robust methods developed to address it if we want indices to be sensitive to tree leaf cover only. For example, we attempted to differentiate foreground versus background by using a brightness threshold.
Summarising our findings, drones can provide consistent data that enables monitoring the progression of individual tree green-up. This is made possible by accurate co-registration of data, for example by using consistent flight plans, and precise georeferencing. More research involving frequent field observations needs to be done to investigate how drone observations relate to the timing of bud-burst and full leafing out of the canopy.
Finally, it’s important to remember that drones are not a substitute for the previously mentioned technologies of phenocams and satellite sensors. In theory, there’s no limit to how often drone surveys can be conducted so they can capture rapid changes. In practice, these kinds of studies are usually still limited by weather conditions and resources. Phenocams on the other hand require minimal maintenance and provide continuous data.
Drones can cover tens of hectares but to get information on vegetation changes over larger areas, satellites are the only option. With the increasing amount of cubesats in orbit taking finer resolution images of the earth surface, single tree information from satellite may well be within reach. Still, drone surveys will remain valuable as a means to validate such information as they will always be more detailed while unaffected by clouds and other atmospheric effects.
Practical Considerations for Researchers
Regarding the practical application of this method to monitor a study site over multiple years, I wanted to include a few considerations regarding efforts and costs involved that might be useful to other researchers:
The work can feasibly be done by one person, aiming for at least weekly acquisitions during periods of rapid green-up. Due to adverse weather conditions, including possibly aborted surveys, this requires quite some flexibility. Selecting an easily reachable study site is therefore highly recommended to reduce overhead.
Defining a feasible plot size to study is also important. For this work, it took approx. one 3DR Solo drone battery to cover 5 hectares. We prioritized good data quality, with >80% overlap, 8 cm ground sampling distance and 5 m/s flying speed to avoid greater viewing angle differences between flight lines. Larger areas can be surveyed by compromising on some of these aspects. The ground sampling distance can be further reduced, though it increases the risk of worse co-registration due to issues during orthomosaic construction. To cover extensive plots, a fixed wing system should be considered instead of multirotors. For multirotors at lower altitude, higher flight speeds are feasible if the camera is gimballed. The maximum flight speed possible without motion blur can be calculated considering the camera’s average shutter speed for good exposure in different lighting conditions. For non-gimballed mounting, there will be viewing angle effects in the data at higher flight speeds, the impact of which on monitoring would need to be investigated.
